6 Bias and equity: the proxy problem
AIM-3 · about 90 minutes
By the end of this chapter you will be able to:
- State the proxy problem in one sentence. Then, for an algorithm you have never seen before, name the thing it measures in place of the thing that matters.
- Explain the Obermeyer study step by step: what the model was built to predict, the harm that caused, and the fix, including how big the fix was.
- For a case you choose, name the stand-in or the data gap, the group harmed and the decision that went differently for them, the fix that followed, and whether that fix is in use today. “Still draft” or “still contested” can be the honest answer.
- Tell apart two kinds of harm (allocation and representation) and two kinds of bias (statistical and social).
- Say what a clinician can and cannot catch at the bedside without seeing inside a model. Cite the evidence that clinicians do not reliably catch a biased model, even when the model explains itself.
Time. About 25 minutes of reading, 25 minutes of listening, 35 minutes of doing, and 5 minutes to write your answer to the closing question. You need a PubMed tab. A chatbot is optional and used for one step you can skip. If you do use one, your institutional ChatGPT Edu or Copilot account is enough. Nothing installs, and nothing here touches a patient’s data.
6.1 The number on the monitor
It is 3 a.m. on your sub-internship and you are cross-covering a medicine floor. A nurse calls about a 61-year-old man admitted with pneumonia. He is breathing faster than he was at midnight. He is using his neck muscles. He has stopped finishing his sentences. You go and look. He is a Black man with dark skin, sweating, leaning forward on the bed. The monitor says his oxygen saturation is 94 percent on two liters.
Ninety-four is a number that lets you go back to bed. The patient in front of you is not. You have a choice: believe the number, or believe the man. You draw an arterial blood gas. The saturation measured directly from his blood comes back at 86 percent.
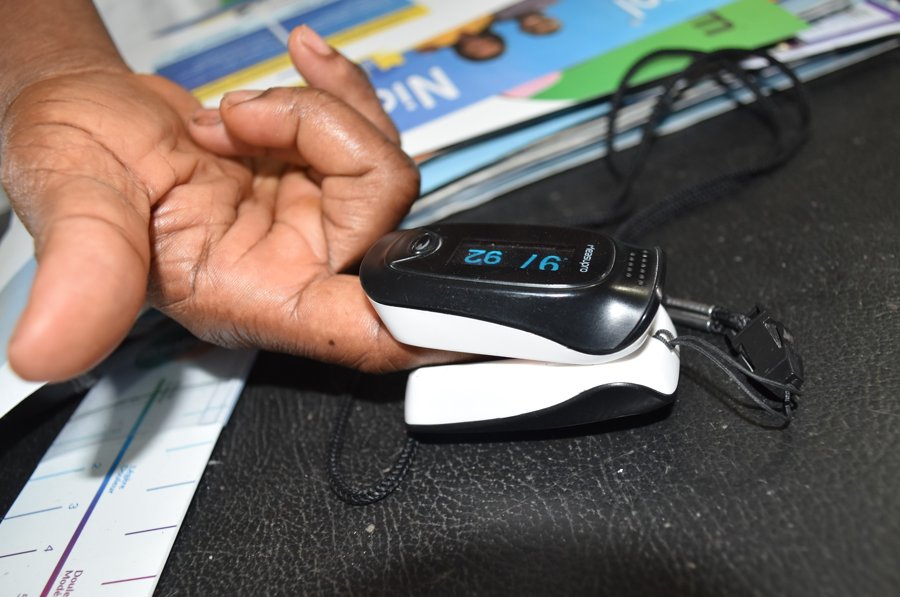
The pulse oximeter was not broken. It was doing what it was designed to do. It shines red and infrared light through a fingertip and measures how much of each comes out the other side. It then converts that into a saturation using a conversion curve built by testing volunteers. Most of the volunteers had light skin. Skin pigment absorbs some of the light too, and the device cannot tell pigment from hemoglobin. For this man, at this saturation, the number on the monitor was eight points too high.
Nobody in the room, including the patient, knew that the device had been calibrated on people who did not look like him. Remember that. The chapter comes back to it.
6.2 Why this matters

In your first month of residency you will act on the output of at least a dozen algorithms. Nobody will call them algorithms. The pulse oximeter, the estimated kidney function on the lab report, the sepsis alert, the risk score that decides who gets a care coordinator, the reference range on a spirometry printout. Most of them work. Several are known to work worse for some of your patients than for others. The ones that fail do so in the same way, for the same reason. Learning that one reason is faster than learning the list, and it also applies to tools that do not have a paper written about them yet.
The second reason is about you. The evidence in this chapter says a clinician at the bedside can catch some of these failures and cannot catch others. Most people guess wrongly about which failures are which. Knowing which kind a tool belongs to tells you whether your own alertness protects the patient or only makes you feel better.
6.3 How it works
6.3.1 One problem, many cases
Every well-documented case of an algorithm harming patients along racial lines in the last decade follows the same pattern. A quantity that mattered could not be measured directly. Something that could be measured was used in its place. The swap made sense at the time. It was still wrong, and wrong in a way that followed existing inequity. Why? The measurable thing was measurable because the health system had already been collecting it. And the health system had already been treating some people differently. The stand-in carried that difference into the algorithm.
The stand-in quantity is called a proxy: something you measure because the real thing cannot be measured. The proxy problem is the whole chapter in one sentence: an algorithm is only as fair as the link between what it measures and what you hoped it measured, and that link can differ by group. It is the first of the course’s three recurring lessons, proxies fail, and this chapter is where that lesson is explained in full. The foundations chapter showed it in the eGFR, a stand-in for a filtration rate nobody measured.
You met an example of this in the critical appraisal chapter, without the name. There, a test-set score in an FDA clearance summary stood in for how well a tool works on patients. A study of 130 such summaries found that about half reported any clinical performance data at all (E. Wu et al., 2021). The proxy in that case was a test score standing in for “works on patients like mine”. This chapter is the same failure with a different quantity standing in.
6.3.2 Case one: light standing in for oxygen
Start with the device from the opening. In this case the stand-in is a physical measurement, and there is a real sign at the bedside that something is wrong.
A pulse oximeter does not measure oxygen. It measures the ratio of red to infrared light absorbed by a fingertip. It then converts that ratio into a saturation using a conversion curve. That curve was built by lowering the oxygen of healthy volunteers under controlled conditions and recording what the device saw. The proxy is light absorbance. The quantity that matters is arterial oxygen saturation. The two agree closely in the people the curve was built on.
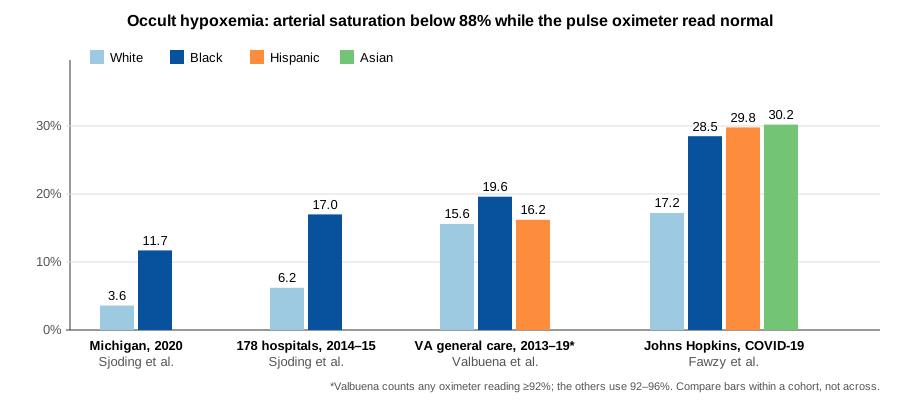
In December 2020, Sjoding and colleagues compared paired readings in two cohorts, meaning two groups of patients: a pulse oximeter value and an arterial blood gas drawn within ten minutes of each other (Sjoding et al., 2020). They looked for occult hypoxemia: an arterial saturation below 88 percent, which is low enough to change treatment, while the oximeter read 92 to 96 percent, which is reassuring. In the University of Michigan cohort it occurred in 11.7 percent of Black patients’ readings and 3.6 percent of White patients’. In a multicenter cohort of 178 hospitals the figures were 17.0 and 6.2 percent. Black patients had nearly three times the rate of a dangerously low saturation that the device called normal.
Two larger studies confirmed the pattern and followed it forward to a decision. Across 30,039 paired readings in Veterans Health Administration general wards, occult hypoxemia was more likely in Black than White patients (Valbuena et al., 2022). Among 1,216 patients with COVID-19 at Johns Hopkins, Fawzy and colleagues found occult hypoxemia in 28.5 percent of Black, 29.8 percent of Hispanic, and 30.2 percent of Asian patients, against 17.2 percent of White patients (Fawzy et al., 2022). Then they followed what happened next. Black patients had a 29 percent lower hazard of being recognized as eligible for COVID-19 treatments that depend on an oxygen threshold. (A hazard is roughly the rate at any given moment.) Among those eventually recognized, the median delay was one hour. And 451 patients never had their eligibility recognized at all, most of them Black. That is how a proxy becomes harm, step by step: a number that looked fine, a treatment threshold never reached on paper, a therapy given late or not at all.
The fix, and its status today. The FDA’s 2013 guidance for pulse oximeter clearance asked manufacturers to include “at least 2 darkly pigmented subjects or 15% of your subject pool, whichever is larger” in a study of roughly ten volunteers. In January 2025 the agency issued a draft guidance. It proposes larger studies with a set spread of skin pigmentation, measured with an instrument rather than by asking the volunteer, and a statement on the label saying whether the device worked equally well across skin tones (Lipnick et al., 2025). The FDA’s page for that guidance still carried the line “Draft. Not for implementation. Contains non-binding recommendations.” when checked on 8 September 2026. A 2025 preprint tested 34 oximeters against the expected criteria. Only one of the 34 passed the draft FDA standard. Eleven devices overestimated saturation more in darkly pigmented participants than in lightly pigmented ones, while others did not (Hughes et al., 2025). The pulse oximeter on your ward tonight is probably a device cleared under the 2013 rule.
This is the case where the bedside answer is encouraging. A saturation that does not match how hard a patient is breathing, how alert he is, or his color is a mismatch any clinician can notice. You do not need to know what photoplethysmography (the light-measurement technique inside the device) is. The blood gas is the check. The difficulty: you have to look at the patient rather than the number, and the number was designed to be looked at.
The sentence for a co-intern: when the number and the patient disagree, believe the patient and get the direct measurement. For this one case, it is also the only fix available to you tonight. Then write the mismatch in the note, with both numbers. The next person covering this patient needs to know that the oximeter reads high on him.
6.3.3 Case two: cost standing in for need
The main case in this chapter is not a device. It is a risk score, and it is the case where there is almost nothing to see at the bedside.
In 2019 Obermeyer and colleagues examined a commercial algorithm used by health systems across the United States (Obermeyer et al., 2019). The algorithm decided which patients should be enrolled in care management programs for high-risk patients: extra nurse contact, help coordinating care. These slots are scarce. Follow it step by step, because each step made sense on its own.
The job. There are far more patients than program slots. Something has to rank them by who would benefit most from extra care.
The measurement problem. “Who would benefit most from extra care” is not a column in any database. Nobody records it. You cannot even define it without knowing what would have happened to the same patient without the program, and that never gets recorded either. So the model’s prediction target, the thing it is trained to predict, became something that is in the database and that plausibly tracks need: future health care costs. Sicker patients cost more. Before reading on, argue for this choice. Cost is objective, recorded for everyone, continuous, and available for every patient without collecting anything new. It is exactly the choice a competent team makes.
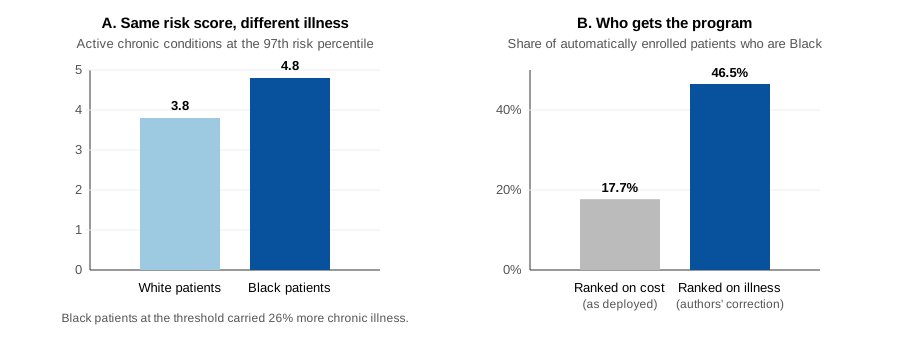
The failure. Cost measures health care consumed, not illness. The health system spent less on Black patients than on White patients at the same level of illness. The reasons are the documented ones: less access to care, less intensive treatment, and every other known disparity in what gets spent on whom. The algorithm was accurate at what it predicted and consistently wrong at what it was used for. At the 97th risk percentile, the threshold for automatic enrollment, Black patients had 26 percent more active chronic conditions than White patients with the same score, 4.8 against 3.8.
The fix. The authors did not stop at the finding. They changed what the model predicted, so that it tracked illness rather than cost, and reran the ranking. In the paper’s own words, remedying the disparity “would increase the percentage of Black patients receiving additional help from 17.7 to 46.5%.” One choice of prediction target, made for defensible reasons, had cut this group’s share of the program by a factor of about two and a half.
Now ask the bedside question. You are the primary care physician for one of these patients. What would you have seen? Nothing. Your patient was not enrolled in a program, and neither were most of your patients. The harm is defined by a comparison across thousands of patients that no individual clinician ever sees. What would have caught it was not better instinct. It was a count: someone checking, on purpose, who was enrolled and who was not, by group, with the power to act on what they found. That is the difference between this case and the oximeter. It is also why the answer at the end of this chapter has two parts, and why both are needed.
6.3.4 Two pairs of terms you will use all chapter
Statistical bias versus social bias. Statistical bias is how far a model’s output is from the thing it was trained to predict. The Obermeyer algorithm had very little of it; it predicted cost well. Social bias is a mismatch between what was predicted and what should have been predicted. A model can be statistically excellent and socially disastrous at the same time, and often the two goals conflict. When a vendor tells you a model is accurate, you now know which of the two they are talking about.
Harms of allocation versus harms of representation. The terms come from Kate Crawford, in a 2017 talk at the NeurIPS conference (a large machine-learning meeting). An allocation harm is a resource handed out unfairly: a program slot, a transplant listing, a dose of oxygen. A representation harm is a system that carries a demeaning or dismissive picture of a group, whether or not any resource is given or withheld. A model that repeats a debunked claim about Black patients’ pain tolerance has harmed someone before any decision is made. Most of the cases below are allocation harms. At least one is not, and the exercise asks you to decide which.
6.3.5 The cases in one table
These cases are about harm to real patients along racial lines, and some readers will have been harmed by the systems described. The chapter treats each one as an engineering review of a failure: a specific decision, its consequence, and its fix. Whether the harm occurred is not in question in any case here; it is documented. The work is in the mechanism.
Table 6.1 lists the cases this chapter draws on, in the four columns the Do block will ask you to fill in for a case of your own. The fourth column is the one to read slowly. “Identified” and “fixed” are different claims, and the second needs its own checking.
| Case | What mattered, and what stood in for it | Who was harmed, through what decision | Fix, and status as of September 2026 |
|---|---|---|---|
| Pulse oximetry | Arterial oxygen saturation; light absorbance calibrated on light skin | Black, Hispanic, and Asian patients; oxygen and COVID-19 therapies delayed or never triggered (Fawzy et al., 2022; Sjoding et al., 2020) | FDA draft guidance, January 2025. Still draft. (Lipnick et al., 2025) |
| Care management risk score | Health need; predicted health care cost | Black patients; left out of care coordination. The fixed version enrolled 2.6 times as many (Obermeyer et al., 2019) | What the model predicts was changed by the authors and, the paper says, by the vendor. Status of the industry’s other scores: not known. |
| Kidney function (eGFR) | True kidney filtration; a creatinine formula with a race multiplier | Black patients; later CKD staging, later transplant referral (Vyas et al., 2020) | NKF-ASN Task Force recommended the race-free 2021 equation for all US laboratories (Delgado et al., 2021). In a College of American Pathologists survey of 3,542 US laboratories, 65.8% had adopted the race-free creatinine equation by March 2023, up from 30.3% a year earlier (Genzen et al., 2022, 2023). No later national count was found. |
| Spirometry | Lung function compared with what is expected; an expected value that was adjusted by race | Black patients; reduced lung function counted as normal, with consequences for disability benefits and transplant priority (Bowerman et al., 2023) | ATS recommended race-neutral equations in April 2023 (Bhakta et al., 2023). Actively contested. Modeling across 249 million Americans estimates 12.5 million reclassified, with nonobstructive impairment rising 141% among Black and falling 69% among White persons, and disability payments shifting by over a billion dollars a year (Diao et al., 2024). Reports from single health systems that made the switch are being published (A. Wu et al., 2025). |
| Dermatology image AI | Disease across all skin tones; training images mostly of light skin | Patients with dark skin; missed or misclassified lesions (Adamson & Smith, 2018; Daneshjou et al., 2022) | Image sets covering all skin tones published; retraining on them closed the gap in one study (Daneshjou et al., 2022). No regulatory requirement for skin-tone reporting. |
| Chest radiograph AI | Disease on the image; labels pulled from the text of old radiology reports | Female, Black, Hispanic, low-income, and uninsured patients, worst for patients in more than one of these groups; findings called normal (Seyyed-Kalantari et al., 2021) | Documented; no fix adopted at scale. The question is who wrote the labels the model learned from. |
| Large language models | Real physiology; text that repeats race-based medicine | Black patients in particular; debunked claims about kidney function, lung capacity, and pain repeated in clinical answers (Omiye et al., 2023; Zack et al., 2024) | Vendors update models without clear version notes. Re-test with each release. |
Three things to notice across the rows rather than in any one of them.
The proxies were all reasonable. Cost is objective. Calibrating a device on the volunteers you have is how devices get built. Report text is the only label available at radiograph scale. Race entered clinical equations through observed population differences that someone was trying to account for. No one in these cases set out to build in inequity. That is why “just don’t be biased” is not a strategy you can use, and asking what the model actually predicts is.
Fixing is slower and messier than finding. Obermeyer is seven years old. The oximeter guidance is still draft. Race-neutral spirometry is recommended and contested at once, and the disagreement is not simple. The same equation change that raises Black patients’ disability eligibility lowers White patients’. The 2024 modeling found the two equations predicted respiratory outcomes about equally well, so the choice between them is not settled by accuracy (Diao et al., 2024). A student who writes “we could not determine the adoption status” in the exercise has answered correctly, and this chapter will say so again in the rubric.
The bedside answers differ sharply by case, and that is the finding. Oximetry has a real bedside sign. Anyone who read the equation could have checked the race-based formulas, and the equation was printed on the lab report the whole time. The chest radiograph model and the care management score are close to undetectable from a single encounter.
6.3.6 The study that complicates the bedside answer
It would be comfortable to leave this chapter believing that a careful clinician catches these. The best evidence says otherwise. (The ethics and regulation chapter draws the same numbers as a figure and asks what they mean in court.)
In a randomized study, Jabbour and colleagues showed 457 hospitalist physicians, nurse practitioners, and physician assistants a series of written cases of patients with acute respiratory failure, with chest radiographs, and asked them to diagnose pneumonia, heart failure, or COPD (Jabbour et al., 2023). Baseline accuracy was 73.0 percent. A standard AI model raised it by 2.9 points, and by 4.4 points when the model also showed an explanation: a heat map showing where on the radiograph it was looking. A deliberately biased model, one built to be wrong in a consistent direction, lowered accuracy by 11.3 points. Adding explanations to the biased model recovered only 2.3 points, a difference that was not statistically significant. Seeing the model’s reasoning did not protect clinicians from its error.
Individual alertness catches the mismatches that appear in the one patient in front of you. The oximeter case is exactly that, and it is not a small category. It does not catch harms that only appear when you count across many patients. And the evidence says it does not reliably catch a confidently wrong model, even with the reasoning on screen. Institutional auditing by group and personal skepticism are both needed. Neither replaces the other.
6.3.7 Why this chapter does not teach you to fix the model
There are technical fixes in the literature: giving some training examples more weight, training the model so it cannot tell groups apart, setting different cut-offs for different groups. They are real, and the fairness deck under Go deeper covers them. None of them would have fixed the Obermeyer algorithm. The target was wrong, and no amount of adjustment afterward fixes a wrong prediction target. That is a stronger point than a survey of methods would have been. It is why the question this chapter gives you is about the target and not the math.
The oximeter was. So were the chest radiograph tools. Clearance answers a different question from the one you are asking. The critical appraisal chapter makes that case in full with the same 130 clearance summaries cited above (E. Wu et al., 2021), and the FUTURE-AI checklist there gives fairness one row and one question for the vendor. This chapter is that row, in depth. If the two chapters are assigned in the same week, read the objection once and remember it.
6.4 Watch or listen
Podcast. NEJM AI Grand Rounds, “The Double-Edged Sword of AI, with Dr. Ziad Obermeyer” (27 July 2023; 74 min). https://ai-podcast.nejm.org/e/the-double-edged-sword-of-ai-with-dr-ziad-obermeyer/
The first author of the cost-for-need paper, interviewed by two physicians who build models. Listen for the phrase task formulation, his term for choosing what the model should predict. His argument is that this choice, made before any data are used, determines more about bias than anything done afterward. That is the proxy problem in the words of the person who documented it. Listen also for the second half of his title. He describes work where an algorithm, trained to predict the right target, reduced a disparity that clinicians had been producing. Twenty-five minutes covers the first argument; the rest is worth hearing if you have the time. The episode is on Apple Podcasts, Spotify, and YouTube if the NEJM player does not load.
If you would rather read. The fairness deck at https://talks.seandavis.net/archive/2024-11-05-ml-fairness/ is the seminar this chapter was adapted from. It opens with two thought experiments, an image search and a loan officer, that make the social-versus-statistical distinction clear without any medicine at all. It also carries a list of the kinds of bias, sorted by where they come from, which you may want for Part B.
6.5 Do
Every step below works from published papers and from an algorithm described in this chapter. Do not test any of it on a patient from your sub-internship, a classmate, or yourself. If you use a chatbot in the optional step, you are asking it about a published paper, not about a person.
What counts as patient information, and why taking out the name is not enough: the patient information page.
6.5.1 Part A: the worksheet, on the case you already know (15 minutes)
This chapter went through the care management algorithm for you. Now do it on paper, without looking back. Below is what a clinician would actually have seen: a tile in a population-health dashboard, the screen a health system uses to track its patients as a group. It is drawn here to show what was and was not visible.
Copy the worksheet into a document and fill in every line. The word “utilization” on the tile is the only clue the clinician was given. Decide whether it was enough.
Case: Care management risk score (Obermeyer et al. 2019)

1. THE PROXY OR DATA GAP
   What quantity actually mattered, and what measurable thing was
   used in its place?
   ____________________________________________________________________

2. WHO WAS HARMED
   Which population, and through what concrete decision? Name the decision
   that went differently, not just the group.
   ____________________________________________________________________

3. WHAT FIX FOLLOWED
   ____________________________________________________________________

4. ADOPTION STATUS RIGHT NOW
   Finalized / adopted / partial / draft / contested / could not determine.
   Where does your answer come from?
   ____________________________________________________________________

5. THE BEDSIDE QUESTION  (spend the most time here)
   What could a clinician have caught WITHOUT knowing how the algorithm
   works inside? What would you have seen, heard, or measured that did not
   fit? If your honest answer is "nothing," say so and say why.
   ____________________________________________________________________

6. Allocation harm, representation harm, or both? One sentence of defense.
   ____________________________________________________________________

7. Statistical bias, social bias, or both? One sentence.
   ____________________________________________________________________
Questions 1 through 4 are lookups. Question 5 is the exercise. If you wrote a sentence there in under two minutes, go back.
6.5.2 Part B: a case of your own (20 minutes)
Now add a row to Table 6.1 for an algorithm in the specialty you are entering. Two ways to find one.
A search recipe. In PubMed, run:
(algorithm OR "artificial intelligence" OR "machine learning" OR "risk score"
 OR "reference equation") AND <your specialty> AND (race OR "skin tone"
 OR "racial bias" OR disparities) AND (bias OR underdiagnosis OR "race-free"
 OR "race-neutral")
Filter to the last five years. Read three abstracts. Pick the one where you can name, from the abstract alone, both what the tool was supposed to measure and what it actually measured. If none of the three gives you both, that is itself a finding. Note it and pick the closest.
Or a pre-vetted case. Each of these is verified and carries at least one open question about adoption, which is the part of the worksheet that teaches the most:
- Dermatology, primary care, oncology: Daneshjou et al. 2022, the Diverse Dermatology Images benchmark (Daneshjou et al., 2022), with the 2018 viewpoint that predicted it (Adamson & Smith, 2018). Note that the viewpoint is commentary, not data, and cite it as such.
- Nephrology, internal medicine, transplant: the race multiplier in eGFR, from the catalog of race-adjusted algorithms (Vyas et al., 2020) to the Task Force recommendation (Delgado et al., 2021).
- Pulmonology, occupational medicine, surgery: race-neutral spirometry, from the equation (Bowerman et al., 2023) to the ATS statement (Bhakta et al., 2023) to the modeling of what changes (Diao et al., 2024). This is the case whose correct question-4 answer is “contested”. Do not simplify it to “fixed”.
- Radiology, emergency medicine, critical care: chest radiograph underdiagnosis (Seyyed-Kalantari et al., 2021). Ask specifically who wrote the ground truth, meaning the labels the model was trained to match.
- Any specialty using a chatbot: language models repeating race-based medicine (Omiye et al., 2023) and building demographic stereotypes into differentials and plans (Zack et al., 2024). This is the case closest to what you will use next year, and the one most likely to be a representation harm.
Fill in the same seven-question worksheet for your case. Then write your row in the four columns of Table 6.1. That row is what you hand in, and the paper you found counts toward this week’s resource log.
Optional step, if you use a chatbot (5 minutes). Ask your institutional ChatGPT Edu or Copilot: “What does <the tool from your case> predict, and what is it used to decide?” Then compare its answer to your worksheet line 1. Does it name the proxy, or does it describe the tool as measuring the thing it was hoped to measure? Models are good at the second and bad at the first, because the papers they learned from mostly wrote it that way. If it named the gap, note that it did. If it did not, you have just watched a stand-in turn into a “fact”, in real time, from a fluent source. Either result is worth one sentence in your notes. If you do not use chatbots, skip this. The exercise is complete without it.
6.6 Check
Score yourself against this before moving on.
| You have | Meets | Falls short |
|---|---|---|
| Worksheet line 1, both cases | Names the quantity that mattered and the thing measured, as two different things | Names the tool, or names one quantity |
| Worksheet line 2, both cases | Names the group and the decision that went differently for them | Names the group only |
| Line 4 | States a status and says where it came from; “could not determine” with a reason counts as meeting | A status with no source, or “fixed” without checking |
| Line 5, the care management case | Says “nothing at a single encounter” and names what would have been needed instead | Claims a bedside sign that does not exist |
| Line 5, your own case | Names a specific sign, or argues specifically why there is none | “Be careful” |
| Lines 6 and 7 | Each label has a one-sentence defense, and you can say which cases are representation harms | Labels without defense |
| The one sentence | You can state the proxy problem without using the word “bias” | “Algorithms can be biased” |
| The second part | You can say what Jabbour et al. found about explanations, and what it means for line 5 | “Clinicians should double-check” |
6.7 What this changes for you
What does this change about how you’ll practice? Write it down before you close this chapter. Two specifics.
First, go back to bed 14. The blood gas is back at 86 percent and the patient is now on high-flow oxygen. Tomorrow on rounds, the attending asks why the oximeter was wrong. Say what it measured and what you hoped it measured, in one sentence, without the word “bias”. Then say whether the patient should be told, and what.
Second, you will use a clinical algorithm in your first month of residency that nobody in this course has heard of. What is the one question you will ask about it? Write your phrasing, not the chapter’s. The live session collects these in chat, and they are worth more than the table.
6.8 Summary
- A proxy is a measurable stand-in for something that cannot be measured. Every well-known case of algorithmic harm in medicine is a proxy that followed inequity: light for oxygen, cost for need, race for unmeasured exposure.
- The proxies were reasonable when chosen. That is why “don’t be biased” is not a strategy and “what does this actually measure” is.
- Obermeyer: predict cost, get accuracy; use it for need, get a factor of 2.6 in who was enrolled. The fix meant changing the target, not the model.
- Statistical bias is error against the target; social bias is the wrong target. Allocation harms move resources; representation harms need no decision at all.
- Finding is fast and fixing is slow. The oximeter guidance is draft; race-neutral spirometry is recommended and contested.
- A clinician at the bedside can catch the oximeter and misses the risk score, and a biased model with explanations still lowered clinicians’ accuracy by nine points. Alertness and auditing are both needed.
- The patient in bed 14 did not know the device was calibrated on people who did not look like him. Decide what you would tell him.
6.9 Go deeper
Papers
- The main case in full, with the extra analysis of other prediction targets (Obermeyer et al., 2019). Twelve pages, and the clearest example in the literature of a fix that changes the question rather than adjusting the model.
- The full catalog of race-adjusted algorithms, across cardiology, nephrology, obstetrics, urology, and pulmonology (Vyas et al., 2020). Read it to see how many equations on your lab reports have a race term you never noticed.
- The spirometry contest as it stands: the ATS statement (Bhakta et al., 2023) and the modeling of who is reclassified (Diao et al., 2024). Together they are the best available example of a fix whose costs and benefits go to different people.
- The oximeter regulatory story: the JAMA viewpoint on the draft guidance (Lipnick et al., 2025) and the 34-device test against it (Hughes et al., 2025).
- Clinicians and biased models, with explanations (Jabbour et al., 2023). The supplementary material shows the heat maps the participants saw. the ethics and regulation chapter redraws the result as a figure.
- Where the dermatology gap comes from and how it closes with data (Daneshjou et al., 2022).
- The language-model cases (Omiye et al., 2023; Zack et al., 2024). Re-run their prompts on this year’s model; the answers change.
Talks
- Fairness in machine learning for healthcare, the deck this chapter was adapted from, including the technical fixes this chapter deliberately left out and the reason they would not have fixed the main case.
- AI and ML in an oncology service line for the institutional part of the answer: who audits, who monitors, and what “incorporate biography” means when race is standing in for exposure. Also in the ethics and regulation chapter.
- Kate Crawford, “The Trouble with Bias”, NeurIPS 2017 keynote, the source of the allocation-versus-representation distinction. On YouTube, about 50 minutes: https://www.youtube.com/watch?v=fMym_BKWQzk (a third-party upload; the NeurIPS talk page at https://neurips.cc/virtual/2017/invited-talk/8742 links the official recording on Facebook).