10 What AI costs the planet: the number everyone quotes
AIM-3 · AIM-X · about one hour
By the end of this chapter you will be able to:
- Trace a widely quoted figure about AI’s environmental cost back to the paper or report it came from, and say what changed at each step on the way to you.
- Name three choices that make credible per-query figures (the cost of one question to a chatbot) differ by more than a hundredfold, and say which choices the figure you traced made.
- Put AI’s per-query cost against your own specialty’s measured footprint, and say what that comparison settles and what it does not.
- Explain how a per-query number can shrink thirtyfold in a year while the total keeps rising, and name who lives next to the data centers that make up the total.
- Ask a vendor one question about their environmental figure that has a checkable answer.
Time. About 20 minutes of reading, 11 minutes of watching, 25 minutes of doing. You need a browser, a calculator, and one general-purpose chatbot. Your institutional ChatGPT Edu or Microsoft Copilot account is enough. Nothing installs, and nothing in this chapter involves a patient’s information.
10.1 Morning huddle
It is the first week of your family medicine rotation, in a county that spent the summer under outdoor watering restrictions. The clinic is rolling out an ambient scribe, the phone app that listens to the visit and drafts the note. At huddle, a second-year resident says she is opting out. She has read that every note the thing writes costs a bottle of water, and she is not going to pour out a bottle of water per patient in a drought. The medical director, who signed the contract, says that is nonsense. He read last month that a prompt, one message to a chatbot, uses about five drops. They look at each other, then at you, because you are the student, and students get asked to look things up. Find out by Friday, he says. Which is it?
Both of them are quoting something real. The bottle traces back to a paper and a newspaper analysis. The five drops trace back to a technical report from the company that runs the model. The two figures differ by a factor of about two thousand. Neither person has read past the headline. Neither, until Friday, have you.
This is the same problem the appraisal chapter gave you at lunch with a vendor: a number that arrives without its method. The difference is that this one is about the planet rather than about burnout. That means it comes with more feeling and less checking. The question is the appraisal question again: what did they count, and did anyone check?
10.2 Why this matters
The figure on the infographic is not about your clinic. It is a claim about what happens somewhere else, to someone else, when you press enter. That makes it a question of fairness, not only a question of adding up carbon. Water and air pollution are local. A data center’s cooling draws from one county’s groundwater. A gas turbine’s exhaust lands in one neighborhood. The people who bear that cost do not use the tool and were not asked. In the emergency department of that neighborhood, an asthma exacerbation is an asthma exacerbation. No one can say what caused it, and you would treat it the same. This chapter is about being able to say, honestly and in proportion, what the tool on your workstation has to do with that.
You will meet the practical version sooner. Within a year someone on your team will refuse a tool on environmental grounds, or dismiss the concern outright. Both will be quoting a headline. Within a few years you may sit on the committee that picks the vendor, and “what is its footprint” will be a line on the purchasing form. The skill that lasts is not a number to quote. The numbers in this chapter will be wrong within eighteen months, and the chapter says so. The skill is asking what was counted.
10.3 How it works
10.3.1 Where the bottle came from
Start with the resident’s bottle and trace it back to its source. Every step is public. You will do this yourself in the Do block, so read this as the worked example.
April 2023. A group at the University of California, Riverside and the University of Texas at Arlington posted a preprint, a paper shared before peer review, titled “Making AI Less Thirsty.” It was published two years later in Communications of the ACM (Li et al., 2025). But the first arXiv version contains the sentence the whole story came from: ChatGPT needs to “drink” a 500 mL bottle of water for a simple conversation of roughly 20 to 50 questions and answers, depending on when and where it runs. Read that carefully. It is a bottle per conversation, not per question: 10 to 25 mL per question. It is an estimate for GPT-3, the model behind the first ChatGPT. It rests on an assumed energy cost of 0.004 kWh per request, which the authors called conservative. And it counts two kinds of water: the water evaporated on site to cool the servers, and the water evaporated off site by the power plants that make the electricity. In the United States the power-plant share is the larger one. The paper’s most quoted number, 700,000 litres to train GPT-3, is about training, not use. The current version of the paper gives the per-response figure as a bottle per 10 to 50 medium-length responses.
September 2024. The Washington Post worked with the same Riverside group to estimate what a 100-word email written by GPT-4 costs. They reported 519 mL of water and 0.14 kWh of electricity for a typical US data center, with a range by location from about 235 mL in Texas to about 1,400 mL in Washington state: about a bottle, and about fourteen LED bulbs for an hour. The headline was “A bottle of water per email.” VERIFY: figures and location assumptions taken from Tom’s Hardware and TechRepublic coverage of the Post article; the article itself is paywalled and was not read, 2026-09-08 Notice what has changed since the preprint: a much larger model, a specific task rather than a “simple” question, and a number roughly twenty to fifty times larger per interaction, whatever the exact assumptions were. The resident’s bottle is this headline, with “per email” changed to “per note” by a year of repetition.
August 2025. Google published a technical report on what a median Gemini text prompt costs on its own computers: 0.24 Wh of energy, 0.03 grams of CO2e, and 0.26 mL of water. A watt-hour (Wh) is what a one-watt LED uses in an hour; a kilowatt-hour (kWh) is a thousand of them. CO2e is carbon dioxide equivalent, the unit that expresses every greenhouse gas as one number. Google’s blog post described the water as “about five drops” (arXiv 2508.15734; Google Cloud blog, 21 August 2025). The energy figure is unusually complete. It includes idle machines, the host computer, and the building’s cooling and power overhead. The report says that over the previous twelve months the energy per prompt fell 33-fold and the carbon 44-fold. The water figure is not complete in the same way. It counts on-site cooling water only, not the water used by the power plants. The Riverside group said so within a day. They pointed out that Google had compared its on-site figure to their on-site-plus-off-site figure and called the difference “orders of magnitude,” meaning several tenfold steps. The medical director’s five drops are this report, with the word “on-site” left out.
Three headlines, three kinds of source: a newspaper working with academics, a vendor reporting on itself, and trade press reporting the academics’ objection to the vendor. Every one of them is about a real number. The resident read the first. The medical director read the second. The honest answer needs the third.
10.3.2 What each of them counted
Put the sources side by side and the disagreement stops looking like a dispute about facts.
| Source | Date | Model | Unit | Water counted | Energy per unit | Water per unit |
|---|---|---|---|---|---|---|
| Li et al., preprint | Apr 2023 | GPT-3 | one Q&A in a “simple conversation” | on-site + off-site | 4 Wh (assumed) | 10–25 mL |
| Washington Post with UC Riverside | Sep 2024 | GPT-4 | one 100-word email | on-site + off-site | 140 Wh | 519 mL |
| Altman, personal blog | Jun 2025 | ChatGPT, “average” | one query, undefined | not stated | 0.34 Wh | 0.32 mL |
| Google, technical report | Aug 2025 | Gemini Apps, median text prompt | one prompt | on-site only | 0.24 Wh | 0.26 mL |
the appraisal chapter gave you three things that can be wrong with a cited claim (Table 5.1): the reference (does the source exist), the attribution (does it say what it is quoted as saying), and the claim itself (is it true). Apply the three to the bottle. The reference is fine: the preprint exists, the newspaper analysis exists. The attribution is where it failed. A bottle per 20 to 50 questions became a bottle per email, which became a bottle per note, and none of those is what the source said. The claim, whether AI use is a meaningful water cost, is a different question from either. It is the one no per-query figure can answer alone.
10.3.3 Three choices that move the number a hundredfold
Figure 10.1 puts every per-query figure in this chapter on one chart. The spread is not error. It is three decisions. Each is reasonable, and each changes the answer tenfold or more.
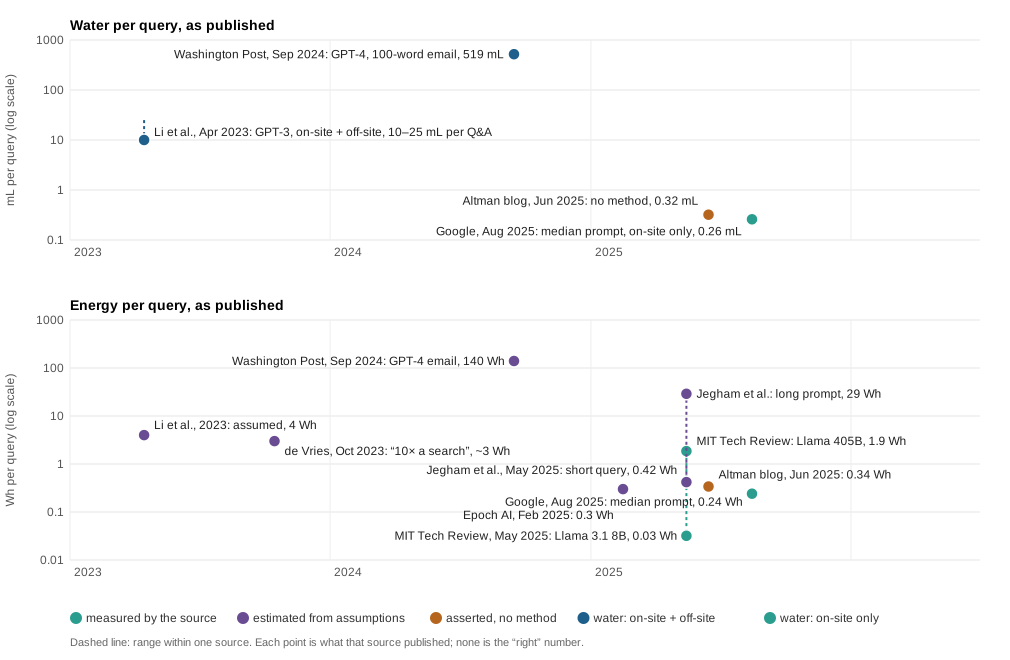
What you count. For water: on-site cooling only, or the power plant’s water too. For energy: the chip while it is computing, or the chip plus everything around it. That means the idle machines waiting for the next request, the host computer, and the building’s cooling and power losses, a multiplier the industry calls PUE, power usage effectiveness. Then there is training. The one-time cost of training the model can be spread across every query it will ever answer (the accounting word is amortized), or left out because it already happened. Google’s energy number counts all of this. Its water number does not. Li et al. counted both kinds of water but assumed the energy. Nobody in Table 10.1 is lying. They are answering different questions.
Which query. A median prompt, or a long one. A short answer, or a 100-word email, which the Post analysis may have treated as more than one request. A plain reply, or a “reasoning” setting, where the model writes out a page of working before it answers. An independent test of thirty commercial models reported short queries around 0.42 Wh and the highest-energy models above 29 Wh for a long prompt, more than 65 times the most efficient model on the same task (Jegham et al., arXiv 2505.09598, May 2025).
Which model, and when. GPT-3 in 2023 and Gemini in 2025 are not the same object. When MIT Technology Review had open models (ones anyone can download and run) measured on the same hardware, the smallest Llama 3.1 model used about 114 joules per response with overhead, and the largest about 6,706. That is a microwave running for a tenth of a second versus eight seconds, a sixtyfold spread from model size alone (O’Donnell and Crownhart, 20 May 2025). Google’s 33-fold drop in twelve months is the same kind of spread, produced by time instead of size. A figure without a model and a date is not a figure.
Every figure in this chapter carries a date, because every one of them will be replaced by a newer one. The “10 times a Google search” line that opens most articles on this topic traces to a 2023 commentary in Joule (Vries, 2023). It compared an estimate for a language model against a Google figure for search energy published in 2009. Real journal, real author, repeated everywhere, and the comparison was fourteen years out of date on the day it was made. Independent re-estimates in 2025 settled near 0.3 Wh for a typical text query, about a tenth of the number that commentary made famous (Epoch AI, February 2025). When you meet a per-query number, the first question is not whether it is right. It is which year and which model it belongs to.
10.3.4 Small per query, large in total
Take the most favorable documented figure and do the arithmetic this chapter depends on. Forty students, fifteen queries a week, four weeks: 2,400 queries. At Google’s 0.24 Wh that is 0.58 kWh, a microwave running for half an hour. At 0.26 mL it is 624 mL of on-site water, a bottle and a bit, for the whole class for the whole month. At 0.03 g CO2e a query it is 72 g. Compare that with US health care’s own measured footprint: 1,692 kg CO2e per person per year in 2018, the highest of any industrialized nation, with 388,000 disability-adjusted life-years lost that year to the sector’s pollution (Eckelman et al., 2020). The class’s month of AI use is a few thousandths of one percent of one person’s share.
State the limit of that calculation, because you will be tempted to stop there. It uses the one per-query carbon figure a vendor has published, which is also the most favorable of the energy figures, and it counts on-site water only. At the Post’s 519 mL the class would have used about 1,250 litres. The honest sentence is this: at the best-documented rate, an individual’s use is negligible, and the published rates differ by about a thousandfold.
Then notice that the individual question is not the question. Google’s energy per prompt fell 33-fold in a year. Google’s total emissions, on its own reports, were 48 percent above its 2019 level in 2023, 51 percent above in 2024, and 81 percent above in 2025, with data-center electricity use up 37 percent in the last of those years (ESG Dive, 2 July 2025; ESG Dive, 2 July 2026). This is the second of the course’s three recurring lessons, efficiency gains get eaten by volume. Economists call it the Jevons effect, after the observation in 1865 that more efficient steam engines led Britain to burn more coal, not less. When a unit of something gets cheaper, people use enough more of it that the total rises. Per-query efficiency is real, and growth in use is faster than the saving. The US Department of Energy’s national laboratory put data centers at 176 terawatt-hours (TWh, a billion kilowatt-hours) in 2023, 4.4 percent of US electricity, and projected 6.7 to 12 percent by 2028 (Berkeley Lab, December 2024). The International Energy Agency projects global data-center demand doubling, from about 415 TWh in 2024 to about 945 TWh by 2030 (IEA, Energy and AI, April 2025). Other bodies project higher. The estimates disagree on method and on how fast AI is adopted. The right thing to do is quote the range with its date, not to average it.
The consequence for the resident is uncomfortable in both directions. Her opting out of the scribe changes nothing measurable. And the medical director’s five drops, multiplied by the volume that makes five drops possible, is the demand the turbines in the next section were installed to meet.
10.3.5 Where the cost lands
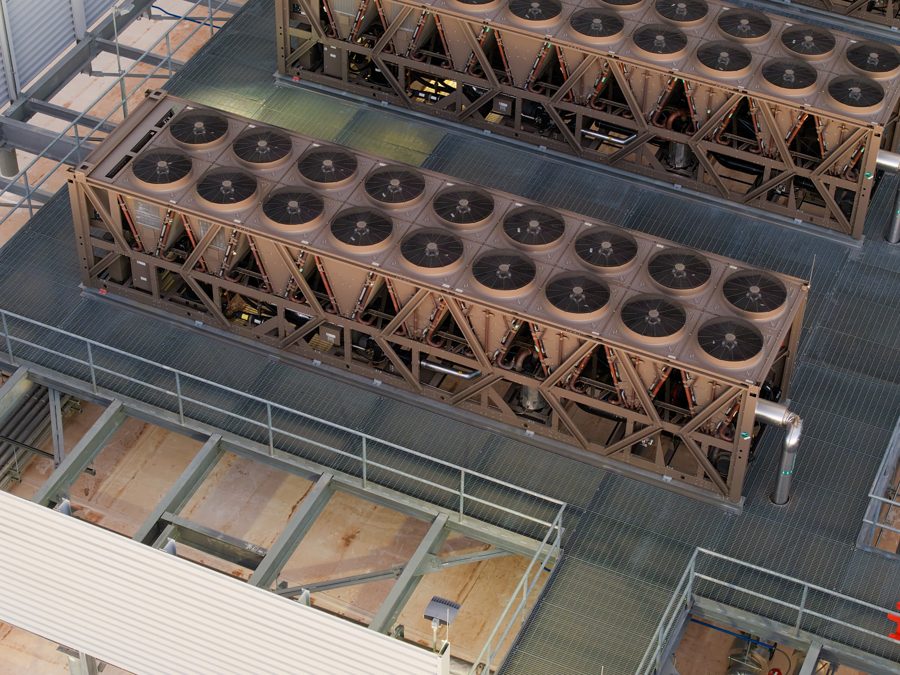

Carbon spreads. Whoever emits it, it warms everyone. Water and air do not spread in the same way. A data center’s cooling comes out of one county’s supply, and a gas turbine’s exhaust settles on one neighborhood. That is why this chapter counts as a fairness chapter as well as an environmental one.
Two-thirds of the data centers built or planned in the United States since 2022 sit in regions already under water stress, meaning short of water. One facility in Newton County, Georgia draws about 500,000 gallons a day, roughly a tenth of the county’s use (Ceres, Drained by Data). In the Memphis area, an AI company ran dozens of gas turbines to power clusters of computers for training a model. At its first site, in South Memphis, the turbines ran for months before any air permit was issued, in a county the American Lung Association had already graded F for ozone. At its second site, just across the state line in Southaven, Mississippi, the NAACP sued in federal court in April 2026 over 27 turbines running without a Clean Air Act permit, half a mile from homes and a mile from an elementary school (Earthjustice case page). By August 2026 local reporting counted more than 50 turbines running there, still without a permit, and the court had not yet ruled VERIFY: turbine count and case status; the injunction hearing was postponed on 21 August 2026 and there was no ruling as of 8 September 2026; the distances are from the complaint as reported, not read by tool The residents of those neighborhoods will present to an emergency department with asthma exacerbations, and the physician seeing them will have no way to link the visit to the turbines. That is environmental exposure as a social determinant of health, in exactly the form you were trained to recognize and can rarely act on.
One more piece of vocabulary, because it decides what a vendor’s number means. A company can report the emissions of the electricity it actually drew from the local electricity grid. That is called location-based accounting. Or it can report the emissions left after subtracting renewable power it bought on contract somewhere else. That is called market-based. Meta’s model card, the published fact sheet, for its Llama 3.1 models reports training at 11,390 tonnes CO2e location-based and zero market-based, in the same table (Meta model card). Both are accepted ways of counting. Only one of them tells the people in Memphis anything.
10.3.6 The denominator, and the claim not to repeat
A per-query number needs a denominator: something of your own to compare it against. Health care is not exempt from the same question. Its footprint is measured, large, and yours. The 1,692 kg per person figure above comes with a state-by-state analysis. Emissions were not correlated with quality of care, which is the authors’ argument that the sector could cut them without harming care (Eckelman et al., 2020). A scoping review of the environmental footprint of digital health tools found no validated method for assessing one across its whole life cycle. Most studies simply estimated the travel that telehealth avoided (Lokmic-Tomkins et al., 2022). The literature on AI’s footprint in medicine is newer, and so far mostly perspective pieces rather than measurements: an NEJM Catalyst piece on rolling out AI sustainably and fairly (Osmanlliu et al., 2025), a Lancet Digital Health overview of the sustainability of large models in care (Selvan, 2026), a Nature Reviews Nephrology comment on weighing benefit against environmental cost (Schmitz et al., 2026), and a Lancet Global Health argument that AI ethics frameworks have given the environment little attention (Fiske et al., 2025).
One measured result is worth more than the perspectives for a purchasing committee. A radiology group ran five sizes of two open models over 3,665 chest radiograph reports and metered the electricity. The 7-billion-parameter model (parameters are a measure of model size) that had been further trained for the task matched the accuracy of a general-purpose model ten times its size. The largest model used more than seven times the energy of the smaller version (Doo et al., 2024). The lesson is the one Figure 10.1 teaches, seen from the buyer’s side: which model you run changes the total more than whether you run one at all.
You will meet the sentence “autonomous AI could cut health care’s emissions by 80 percent.” It comes from a real, careful study. It compared the greenhouse-gas cost of one autonomous diabetic-retinopathy screening visit with one in-person specialist visit, and found the AI visit about 80 percent lower (Wolf et al., 2022). That is a finding about one screening test replacing one kind of visit. It is not a finding about health care, and the paper does not claim it is. If you repeat it as a general claim you have made the attribution error from Table 10.1, in the optimistic direction. The bottle and the 80 percent are the same mistake with opposite politics.
10.4 Watch or listen
Video. Sasha Luccioni, AI is dangerous, but not for the reasons you think, TEDWomen, October 2023 (11 min; transcript and subtitles on the TED page). https://www.ted.com/talks/sasha_luccioni_ai_is_dangerous_but_not_for_the_reasons_you_think Also as a podcast episode, TED Talks Daily, 31 October 2023, 11 min.
Luccioni led the team that measured the training footprint of BLOOM, one of the few large models whose energy and carbon were published in full. She also built the public leaderboard that rates models’ energy use on standard tasks. Listen for what she says she counted when she measured a model, and for the date: the talk comes before every 2025 figure in Figure 10.1. Then ask whether anything she says about carbon has since become less true, or only smaller per query. The eleven minutes cover copyright and bias as well; the environmental section is the first third.
Reading alternative. MIT Technology Review, “We did the math on AI’s energy footprint” (O’Donnell and Crownhart, 20 May 2025). Read it after the guessing exercise in the Do block, not before. If you read it first, skip step 1 of Part A; the point of step 1 is to guess before you know.
10.5 Do
Nothing in this exercise involves a patient. You will ask a chatbot about itself and read public documents. Your university chatbot account is covered for patient care when you sign in with university credentials, but this exercise is not patient care; the ethics and regulation chapter takes that up. If a question about the scribe’s water use ever tempts you to paste in a note to “see what it costs,” stop.
What counts as patient information, and why taking out the name is not enough: the patient information page.
10.5.1 Part A: trace the bottle (15 minutes)
Step 1. Guess, then ask. Before opening anything, write down your own estimate of the water one chatbot question uses, in millilitres. Then ask your chatbot, in a fresh conversation:
How much water does one ChatGPT query use? Give me the number, the unit it is per, the model and year it applies to, and the primary source with a link.
Record exactly what it says. You are not trusting it; you are recording what it said so you can check it. Note whether it gave a source at all, and whether the source is one of the four in Table 10.1. The answer will change with the wording, the day, and the tool. That is itself a finding. If a classmate got a different number, compare the two before you compare either to the sources.
Step 2. Open the sources. Three tabs, all free:
- The preprint, first version: arxiv.org/abs/2304.03271v1. Open the PDF and search for “500ml”.
- Google’s report: arxiv.org/abs/2508.15734. Read the abstract, then search for “water” and find the sentence that says what the water figure includes.
- The Post analysis, or if it is paywalled for you, the TechRepublic summary of it: techrepublic.com.
For each, fill one row:
Source        Date     Model     Unit ("per ___")     Water counted        Number
Preprint      ______   ______    ________________     _______________      ______
Post          ______   ______    ________________     _______________      ______
Google        ______   ______    ________________     _______________      ______
Chatbot said  ______   ______    ________________     _______________      ______
Step 3. Make them comparable. Convert each to millilitres per single question. The preprint gives a bottle per 20 to 50 questions; divide. The Post gives one email; decide, and say, whether you treat that as one question. Google gives one prompt. Then compute the ratio of the largest to the smallest.
Preprint, per question:  ______ to ______ mL
Post, per question:      ______ mL   (I treated one email as ___ question(s))
Google, per prompt:      ______ mL   (on-site only)
Ratio, largest/smallest: ______

The single choice that explains most of the ratio is: ________________
Step 4. The verdict, in one sentence each. Write what you will say to the resident and what you will say to the medical director. Each sentence must name the source’s date, model, and what it counted. “It’s complicated” is not a sentence.
10.5.2 Part B: your specialty’s denominator (10 minutes)
The per-query number means nothing without something of yours to put it against. Find your own specialty’s measured footprint. In PubMed:
("carbon footprint" OR "greenhouse gas" OR "life cycle assessment")
AND <your specialty, or one procedure you will do a lot of>
Filter to the last five years. Skim titles for one paper that reports a number per encounter, per procedure, or per test: kilograms of CO2e per MRI, per laparoscopic cholecystectomy, per dialysis session, per telepsychiatry visit. Anesthesia, surgery, radiology, nephrology, and ophthalmology all have papers on this. If your specialty does not yet, use Eckelman’s 1,692 kg per person per year (Eckelman et al., 2020) and divide by a plausible number of encounters. This paper also counts toward this week’s resource log.
Paper: __________________________________   PMID: ____________
Unit: one _______________   Footprint: ______ kg CO2e

At Google's 0.03 g per prompt, one of my units equals ______ prompts.
At the highest energy figure in the chapter (29 Wh, Jegham et al.), using
Google's own ratio of 0.03 g per 0.24 Wh (about 0.125 g per Wh, so about
3.6 g per long prompt), it equals ______ prompts.

The sentence I would actually say: ___________________________________
The two prompt counts will differ a hundredfold and both will be large. That is the result. What it settles is that your own use does not decide the total. What it does not settle is the total, which is a different question and was never yours to answer alone.
10.5.3 Part C: one question and one rule (5 minutes)
The vendor question. Nobody has published a measured figure for an ambient scribe. The way to get one is to ask. Write one question you would put to the scribe vendor at the next contract review, one that has a checkable answer. The three that matter most. Does the reported footprint use location-based or market-based accounting? Where is inference physically hosted, and how carbon-heavy and water-short is the grid there? (Inference is the running of a trained model to answer requests, as opposed to training it.) Does the per-note figure include the training cost spread across queries, idle capacity, and cooling? A good fourth is whether they will publish a standardized energy score for the model they run.
One rule and one non-change. Write one practice you will actually keep, and one thing you considered changing and decided was not worth it, with the reason. A student who writes “I will keep using a model for literature search because my footprint is negligible against the clinical benefit, and the decision that matters is purchasing, not my own use” has done the reasoning this chapter asks for. So has the one who writes the opposite, if the reason is as specific.
10.6 Check
Score yourself before moving on.
| You have | Meets | Falls short |
|---|---|---|
| A traced chain (Part A) | Each of the three sources has a date, a model, a unit, and a statement of which water was counted, all read from the source, not the headline | “The Post said a bottle” |
| A ratio and its explanation (Part A) | The ratio is computed, and the single choice that explains most of it is named | “They just disagree” |
| Two verdict sentences (Part A) | Each names a date, a model, and what was counted; each could be said aloud at huddle | “It depends” |
| Three choices (objective 2) | On-site versus total water; which query; which model and year, or equivalents, in your own words | Fewer than three, or “methodology” |
| A denominator (Part B) | A real paper, a real unit, an arithmetic comparison, and a sentence that says what it settles and what it does not | A comparison with no source, or one that concludes “so it doesn’t matter” |
| The Jevons sentence (objective 4) | You can say how per-query cost fell and total rose in the same year, with a source and date, and name who lives near the data centers that make up the total | “Efficiency is improving” |
| The vendor question (Part C) | Has a checkable answer; you can say what a bad answer would look like | “Is it sustainable?” |
| The rule and the non-change (Part C) | Both are specific and the reason is the arithmetic, not the mood | A rule with no reason, or no non-change |
10.7 What this changes for you
What does this change about how you’ll practice? Write it down before you close this chapter. Then go back to Friday’s huddle. The resident is still opting out and the medical director is still certain. You have three sources open and a ratio of about two thousand. What do you say to each of them, in one sentence each? And what do you say about the county’s water that is true at every point on Figure 10.1? Then the harder one. The scribe will be recording your patients either way. Whether they are told belongs to the patient-communication chapter, not to a water figure. Does what you learned this week change whether you use it? If not, what would?
10.8 Summary
- The bottle and the five drops are both real. They come from 2023–2024 and 2025, for different models, per different units, counting different water. The gap between them is about what was counted, not about who is lying.
- Three choices move a per-query figure a hundredfold: what you count, which query, which model and when. A figure without a model and a date is not a figure.
- The reference was fine; the attribution failed. A bottle per 20 to 50 questions became a bottle per email, which became a bottle per note.
- At the best-documented rate, an individual’s use is negligible against health care’s own 1,692 kg per person per year. The published rates differ by about a thousandfold, and the honest sentence says both.
- Per-query cost fell 33-fold in a year while the same company’s total emissions rose to 81 percent above its 2019 level. That is the Jevons effect, and the people who live next to the data centers and turbines were not asked.
- Location-based and market-based accounting are both accepted and give different answers. Ask which one you are being shown.
- The “80 percent” claim is about one screening test, not about health care. The bottle and the 80 percent are the same error in opposite directions.
- Which model a vendor runs changes the total more than whether you send the prompt. Take the question to the people who buy the tool, and include the date with it.
10.9 Go deeper
Papers
- The water paper in its published form (Li et al., 2025), and the first arXiv version for the sentence the story came from.
- Google’s per-prompt method, arXiv 2508.15734, and the Register piece above for the on-site objection.
- The 2023 Joule commentary the “10× a search” line comes from (Vries, 2023); read it against the 2025 Epoch AI re-estimate to see how a number goes out of date.
- Luccioni, Jernite, and Strubell, “Power Hungry Processing” (arXiv 2311.16863, 2023): the first systematic comparison of the cost of running models, task by task, and the finding that general-purpose models cost orders of magnitude more per task than small specialized ones. The radiology study (Doo et al., 2024) is that finding reproduced on chest radiograph reports.
- US health care’s footprint (Eckelman et al., 2020); the scoping review of digital-health footprints (Lokmic-Tomkins et al., 2022); and a 2026 systematic review of “green AI” in health applications, which argues AI can add to the footprint and reduce it (Alzoubi & Mishra, 2026).
- The health-specific perspectives: NEJM Catalyst (Osmanlliu et al., 2025), Lancet Digital Health (Selvan, 2026), Nature Reviews Nephrology (Schmitz et al., 2026), Lancet Global Health (Fiske et al., 2025).
- The retinopathy paper the 80 percent comes from (Wolf et al., 2022), to see what a careful single-use-case estimate looks like before it is generalized.
Explainers and tools
- MIT Technology Review, We did the math on AI’s energy footprint (20 May 2025), and Hannah Ritchie’s running estimate (updated August 2025), which is the closest thing to an answer that is kept up to date.
- Hugging Face AI Energy Score leaderboard: models rated on standard tasks on identical hardware, free to browse. If a vendor’s model is not on it, ask why.
- Electricity Maps: how carbon-heavy the electricity is in each region, updated live. Open it and find where your vendor hosts; where a model runs matters as much as which one.
Talks
- Machine learning fairness: the fairness vocabulary behind “Where the cost lands” (procedural, distributive, and representational fairness), and the two opening thought experiments that this chapter’s guess-first-then-check exercise borrows from. It is the bias and equity chapter’s reading alternative.